A Monte Carlo model in TukeySheets is a sheet of columns. Each uncertain input gets a column of draws from the SAMPLE.* family. One spill-vector combines those columns into a column of results. Summary stats sit in cells next to the model and recompute whenever an input changes.
The rest of this post builds a sales-pipeline simulation and shows each piece.
Each input is a column
I want a distribution of monthly revenue from a four-stage funnel: leads in, demos booked, deals closed, dollars per deal. Four uncertain inputs, four columns, ten thousand draws each:
A3:  =SAMPLE.POISSON(80, 10000)             leads per month
B3:  =SAMPLE.BETA(8, 12, 10000)             lead → demo rate (~40%)
C3:  =SAMPLE.BETA(3, 7, 10000)              demo → close rate (~30%)
D3:  =SAMPLE.LOGNORMAL(9.5, 0.6, 10000)     deal size, in dollars
The distribution choice tracks the shape of each input. Lead counts are integer arrivals, so Poisson. Rates live in [0, 1], so Beta. Deal sizes are positive and skewed, so Lognormal. Each anchor cell shows a resample button; clicking it redraws that column alone.
The result is a spill-vector
Revenue per simulated month is the row-wise product of A, B, C, and D:
E3: =A:A * B:B * C:C * D:D
One formula spills ten thousand rows. When A through D change — by edit or by resample — E recomputes.
Analysis is ordinary formulas
Once the result is a column, every question about it is a cell formula:
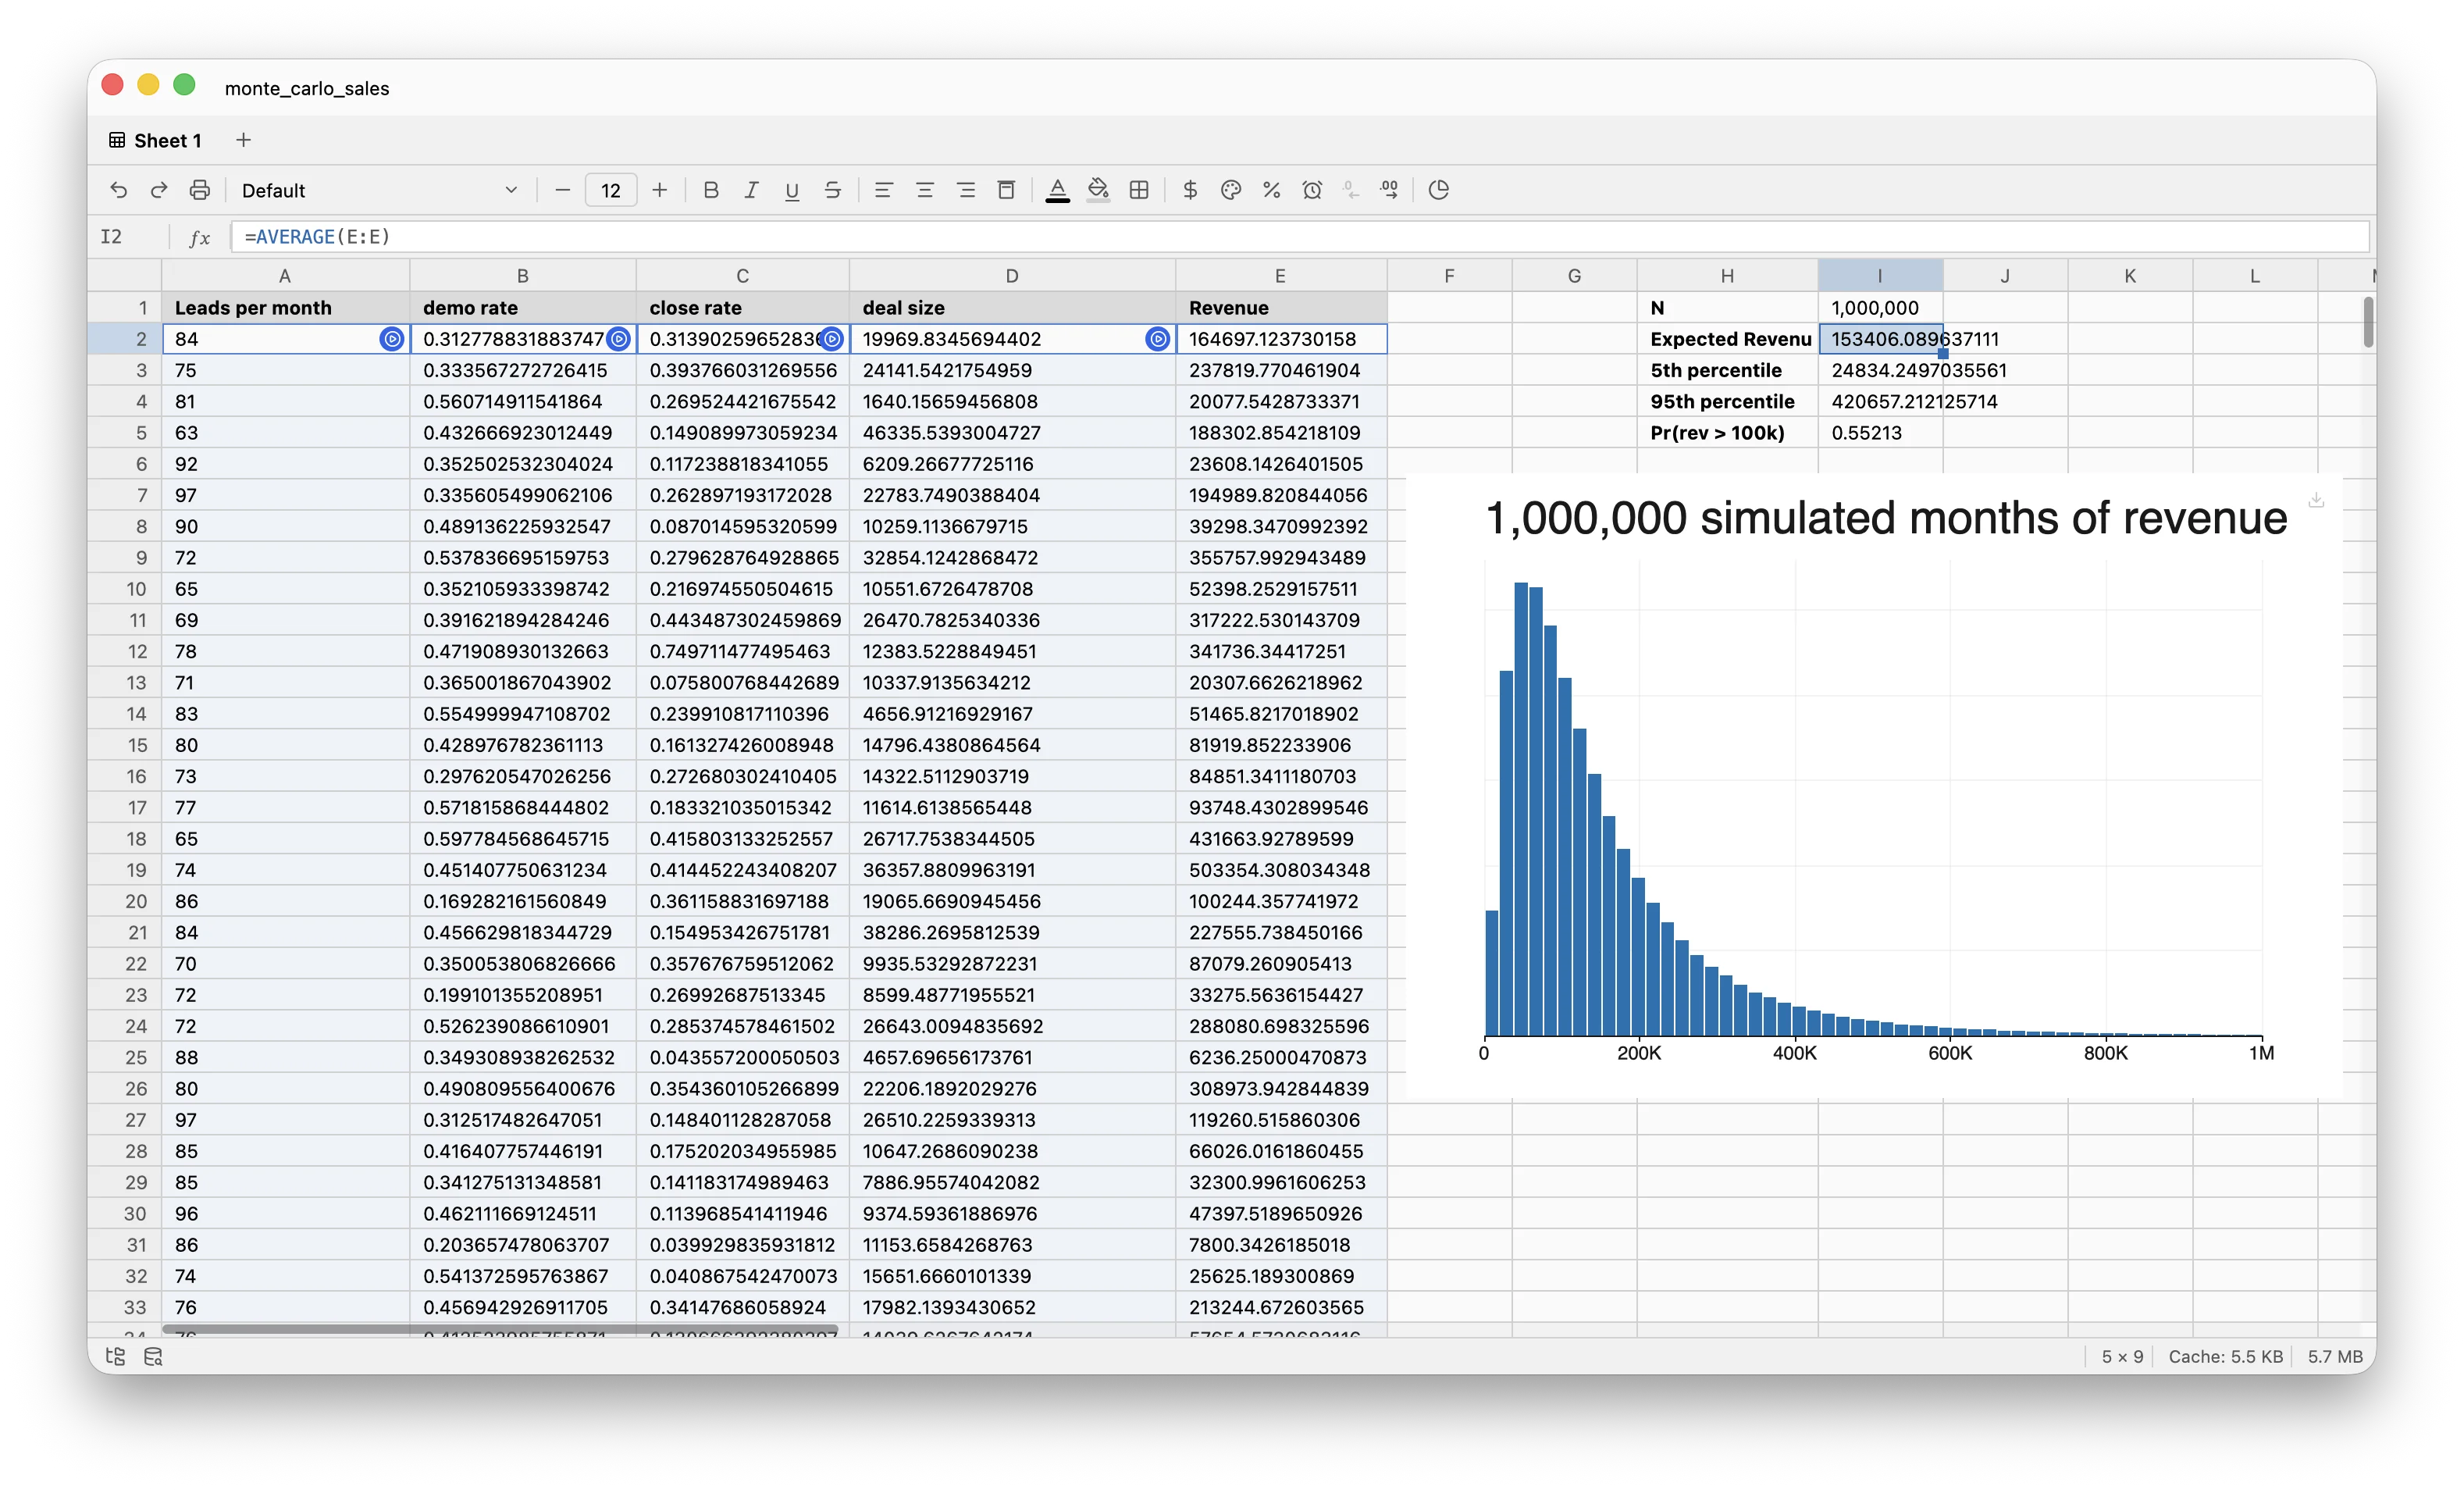
G3:  =AVERAGE(E:E)                          expected revenue
G4:  =PERCENTILE(E:E, 0.05)                 5th percentile
G5:  =PERCENTILE(E:E, 0.95)                 95th percentile
G6:  =COUNTIF(E:E, ">100000") / 10000       P(revenue > $100k)
A histogram on E shows the shape. Edit SAMPLE.BETA(3, 7, ...) to SAMPLE.BETA(4, 6, ...) and every cell above, plus the chart, recomputes. Click the resample button on D to isolate the deal-size noise: D redraws, E follows, G3:G6 update.
One trade-off
SAMPLE.* owns its cell. It anchors a column; it does not return a value to a containing formula. =SUM(SAMPLE.NORMAL(0, 1, 100)) will not work.
That is the cost. The benefit is that every variable in the model lives in its own column, visible, labeled, charted, and individually resampleable. The model is the sheet.
Deterministic sweeps with SEQ
For sensitivity rather than randomness, SEQ spills the same shape without the random part:
=SEQ.LINEAR(0, 1, 101)              101 evenly spaced values from 0 to 1
=SEQ.STEPS(0, 100, 5)               0, 5, 10, …, 100
No resample button — the values are deterministic. I use these to sweep one input across a range while holding the rest fixed.
The family
Continuous: Normal, t, χ², F, Beta, Gamma, Lognormal, Exponential, Uniform, Weibull, Cauchy. Discrete: Poisson, Binomial, NegativeBinomial, Geometric.